Interfaces
Introduction
DEFINITION
A zone, whether real or virtual, that separates two elements. The interface thus refers to what each element needs to know about the other in order to run correctly.

Figure 42: Interfaces
The Interfaces menu presents different statistics concerning:
- Bandwidth
- Connections
- Throughput
Statistics are displayed in the form of graphs. Both vertical and horizontal axes are graduated. The horizontal scale represents time. The vertical scale represents one of the following:
- Bandwidth percentage.
- The number of connections, or
- Throughput expressed in bytes, kilobytes or megabytes.
Interface types
- VLAN.

- Ethernet.

- PPTP.

- Dialup.

REMARK
The interfaces are grayed out or do not appear at all when they are disabled.
This screen consists of 3 views:
- A view of the interfaces in the form of a table (or legend)
- A details zone.
- A zone for viewing graphs.
Legend view (or tabular view of interfaces)

Figure 43: Interfaces – Legend
This view allows you to view all the interfaces that the firewall has detected. Each line represents an interface.
The information provided in the “Legend” view is as follows:
|
Name |
Name and color assigned to the interface. The colors allow you to distinguish the interface in the various graphs. |
|
Type |
Type of interface with a matching icon. |
|
IPv4 Address/ Mask |
IPv4 address and subnet mask of the interface. |
|
IPv6 Address/ Mask |
IPv6 address and subnet mask of the interface. |
|
Incoming throughput |
Indicates the actual incoming throughput. |
|
Outgoing throughput |
Indicates the actual outgoing throughput. |
|
Connections |
Number of real-time connections on each interface of the firewall over a defined period. |
|
Media |
The default value is 0. The throughput of a network interface can be configured via the firewall's web administration interface. |
|
Bandwidth |
Indicates the percentage of bandwidth used for an interface. |
|
Stats |
If this option is selected, the graph corresponding to this interface will be displayed. |
REMARK
Inactive interfaces are grayed out.
You will notice the colors of the visible interfaces at the top of the window. These colors are defined in the network parameters of the firewall for each interface (refer to the Stormshield Network Security user manual).
The Actions button makes it possible to perform certain actions on the selected event (for further information, please refer to the section Pop-up menu on rows):
- Filter by these criteria,
- Filter only this column by this criterion,
- Display hosts associated with this interface.
“Details” view
Each table summarizes throughput statistics for each interface.
The details zone provides the following information:
- Name, IP address, subnet mask (American format), connection type (10 or 100Mbits, half duplex or full duplex).
- Instantaneous (left) and maximum (right) throughput.
- Number of packets and volume in bytes for TCP, UDP and ICMP.
- Number of TCP connections.
- Total number of packets accepted, blocked and fragmented by the Firewall.
“Bandwidth” tab
The bandwidth graph displays the percentage of use of the available bandwidth on each interface in real time.

Figure 45: Interfaces - Bandwidth
Each interface is represented by a different color of which the legend may be found at the top of the graph. Maximum bandwidth represents the theoretical maximum throughput supported by the interface.
Example
For a 100Mbits/s line used in full duplex, this maximum is 200 Mbits/s, and for a 10Mbits/s line used in half duplex it is 10 Mbits/s.
“Connections” tab
The connection graph displays in real time the number of connections on each of the Firewall’s interfaces during the defined period.

Figure 46: Interfaces - Connections
Each interface is represented by a different color of which the legend may be found at the top of the graph.
“Incoming connections” tab
The screen displays incoming connections in progress relating to the selected interface. To find out what data is offered, please refer to the section of the Hosts module, section “Connections” view for the Hosts tab.
The Actions button makes it possible to perform certain actions on the selected event (for further information, please refer to the section Pop-up menu on rows):
- View source host,
- View destination host,
- Send connection to quarantine
“Outgoing connections” tab
The screen displays outgoing connections in progress relating to the selected interface. To find out what data is offered, please refer to the section of the Hosts module, section “Connections” view for the Hosts tab.
The Actions button makes it possible to perform certain actions on the selected event (for further information, please refer to the section Pop-up menu on rows):
- View source host,
- View destination host,
- Send connection to quarantine
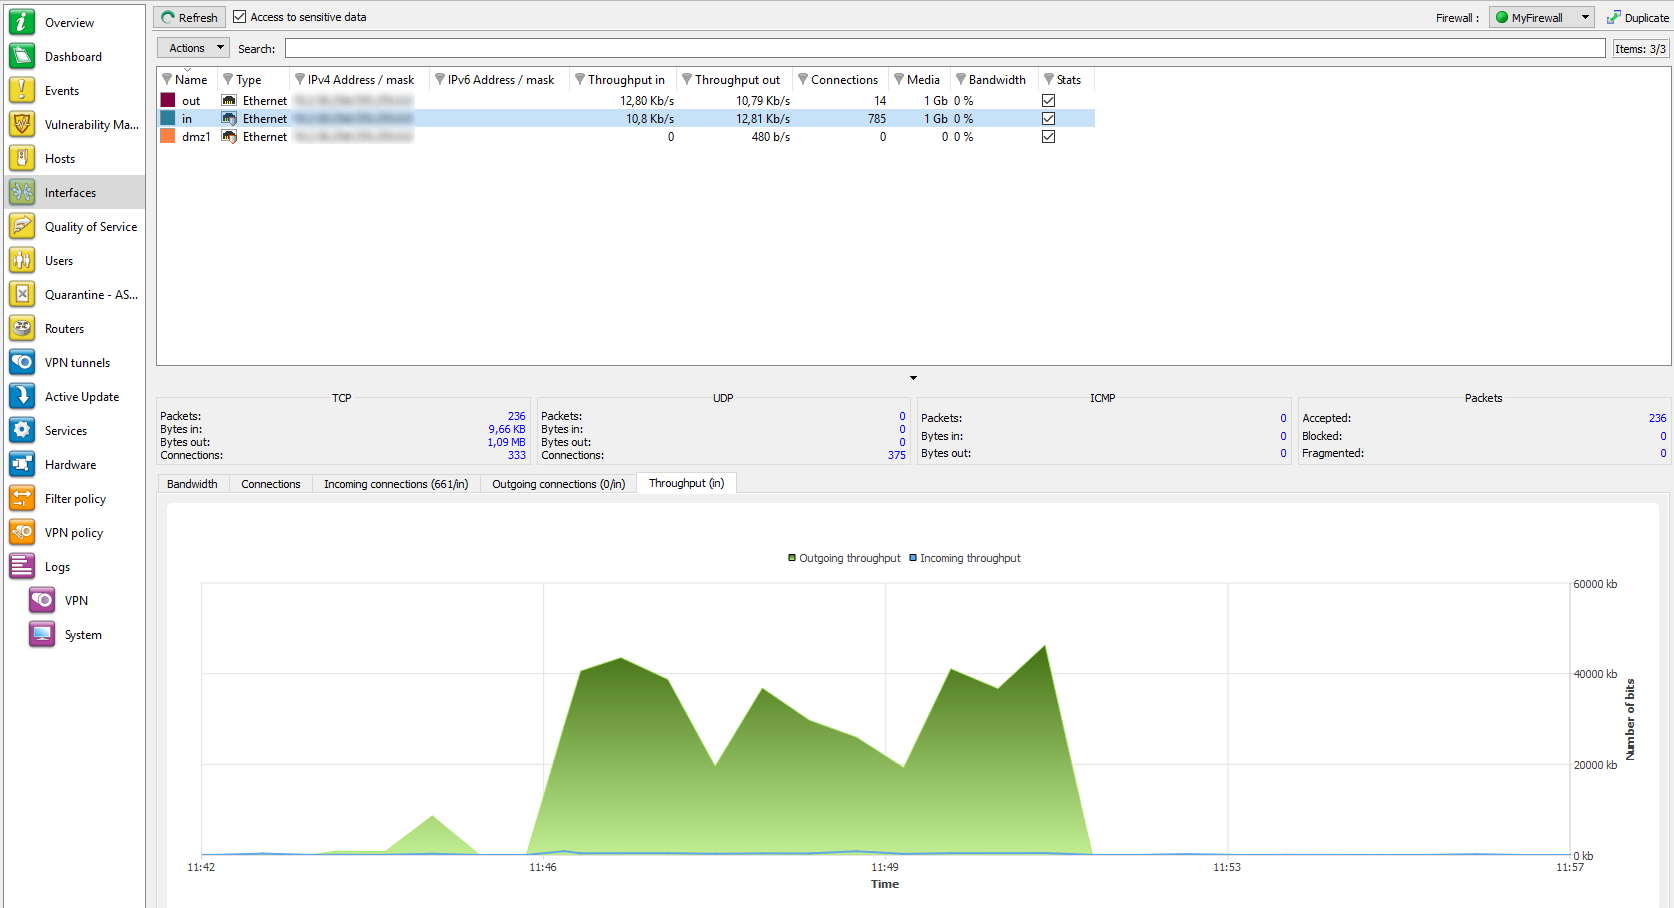
“Throughput” tab
The throughput graph represents the real throughput on each of the Firewall’s interfaces. The throughput scale automatically adapts to the maximum throughput recorded during the period.

Figure 47: Interfaces - Throughput
For each interface, the throughput graph indicates the ingoing and outgoing throughput.
To modify the interface on which throughput is viewed, click on this interface in the legend at the top right section of the graph. The interface currently being viewed will be highlighted in blue.