Checking bypass status
This section explains how to check the bypass status on the bypass segments of an SNS firewall (Safety mode enabled, bypass mechanism triggered, etc.).
In the dashboard module
This use case is exclusive to SNS 4.8 and higher versions.
In the web administration interface, go to Monitoring > Dashboard. The Network widget provides a graphical representation of the interfaces on an SNS firewall:
-
When Safety mode is enabled (bypass mechanism ready to be triggered), interface numbers on bypass segments appear in an orange circle,

-
When the bypass mechanism has been triggered, interfaces on bypass segments appear in orange with a two-way arrow that links them.

In the CLI/Serverd console
You can interact with the bypass by using the command set SYSTEM BYPASS and the command MONITOR BYPASS.
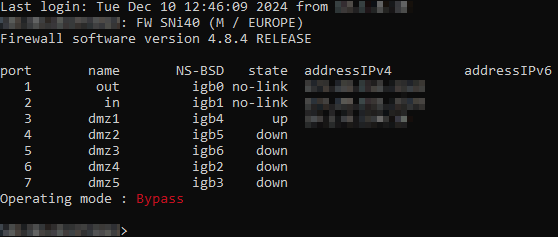
In the CLI/SSH console
The bypass operating mode appears in a message after authentication:
- "Operating mode : Security" indicates that Security mode is in use,
- "Operating mode : Safety" indicates that Safety mode is enabled,
- "Operating mode : Bypass" indicates that the bypass mechanism has been triggered.
In the CLI/SSH console, you can interact with the bypass by using the command enbypass.
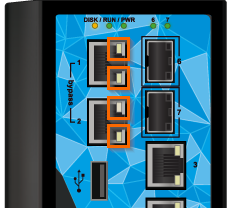
With the status of LEDs on RJ45 network port connectors
By going to the physical location of the SNS firewall, you can check the status of LEDs on the RJ45 network port connectors of bypass segments.
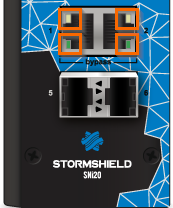
SNi40 and SNi20
When the bypass mechanism has been triggered, LEDs on RJ45 network port connectors of bypass segments are switched off on SNi40 and SNi20 firewalls.
|
|
|
With logs
Several bypass-related logs can be generated. Here are a few examples:
Bypass mechanism triggered as the watchdog has timed out
id=firewall time="YYYY-MM-DD HH:MM:SS" fw="SNXXXXXXXXXXXXX" tz=+0200 startime="YYYY-MM-DD HH:MM:SS" pri=6 service=hardwared msg="Bypass mode triggered: timer expired"
Bypass Safety mode enabled (bypass mechanism ready to be triggered)
id=firewall time="YYYY-MM-DD HH:MM:SS" fw="SNXXXXXXXXXXXXX" tz=+0200 startime="YYYY-MM-DD HH:MM:SS" pri=5 service=enbypass msg="Bypass activated on segments 0,1,2,3"
On SNi40 and SNi20 firewalls, the bypass segments in question do not appear.
Bypass mechanism reset (Safety mode reset)
id=firewall time="YYYY-MM-DD HH:MM:SS" fw="SNXXXXXXXXXXXXX" tz=+0200 startime="YYYY-MM-DD HH:MM:SS" pri=5 service=enbypass msg="Run-time bypass watchdog rearmed"
With MIBs and SNMP traps
Information on the status of the bypass on the SNS firewall's bypass segments can be retrieved with the MIB STORMSHIELD-SYSTEM-MONITOR-MIB, SNMP table snsBypassTable.
To do so:
- Download the SNMP MIBs from your MyStormshield personal area, in Downloads > Downloads > Stormshield Network Security > SNMP MIBs.
- Configure the SNMP agent module in the SNS firewall web administration interface.
For more information, refer to the SNMP agent section in the SNS user manual.