Dashboard
Introduction
 The Dashboard menu allows displaying on a single screen all the useful information concerning real-time monitoring.
It basically picks out useful information from some of the menus in the Stormshield Network Real-Time Monitor tree and adds on other additional information. The data displayed in this window are:
- System information
- Memory
- Temperature
- CPU
- Hardware
- Active network policies
- Alarms
- Vulnerabilities
- VPN tunnels
- Active Update
- Logs
- Services
- HTTP Cache
- Interfaces.
- Top 5 interfaces for incoming throughput
- Top 5 interfaces for outgoing throughput
- Top 5 hosts for incoming throughput
- Top 5 hosts for outgoing throughput
Checkboxes allow showing or hiding details of each category of information. The status of each checkbox (enabled/disabled) is remembered in order to display the dashboard with the same layout the next time SN Real-Time Monitor is started.
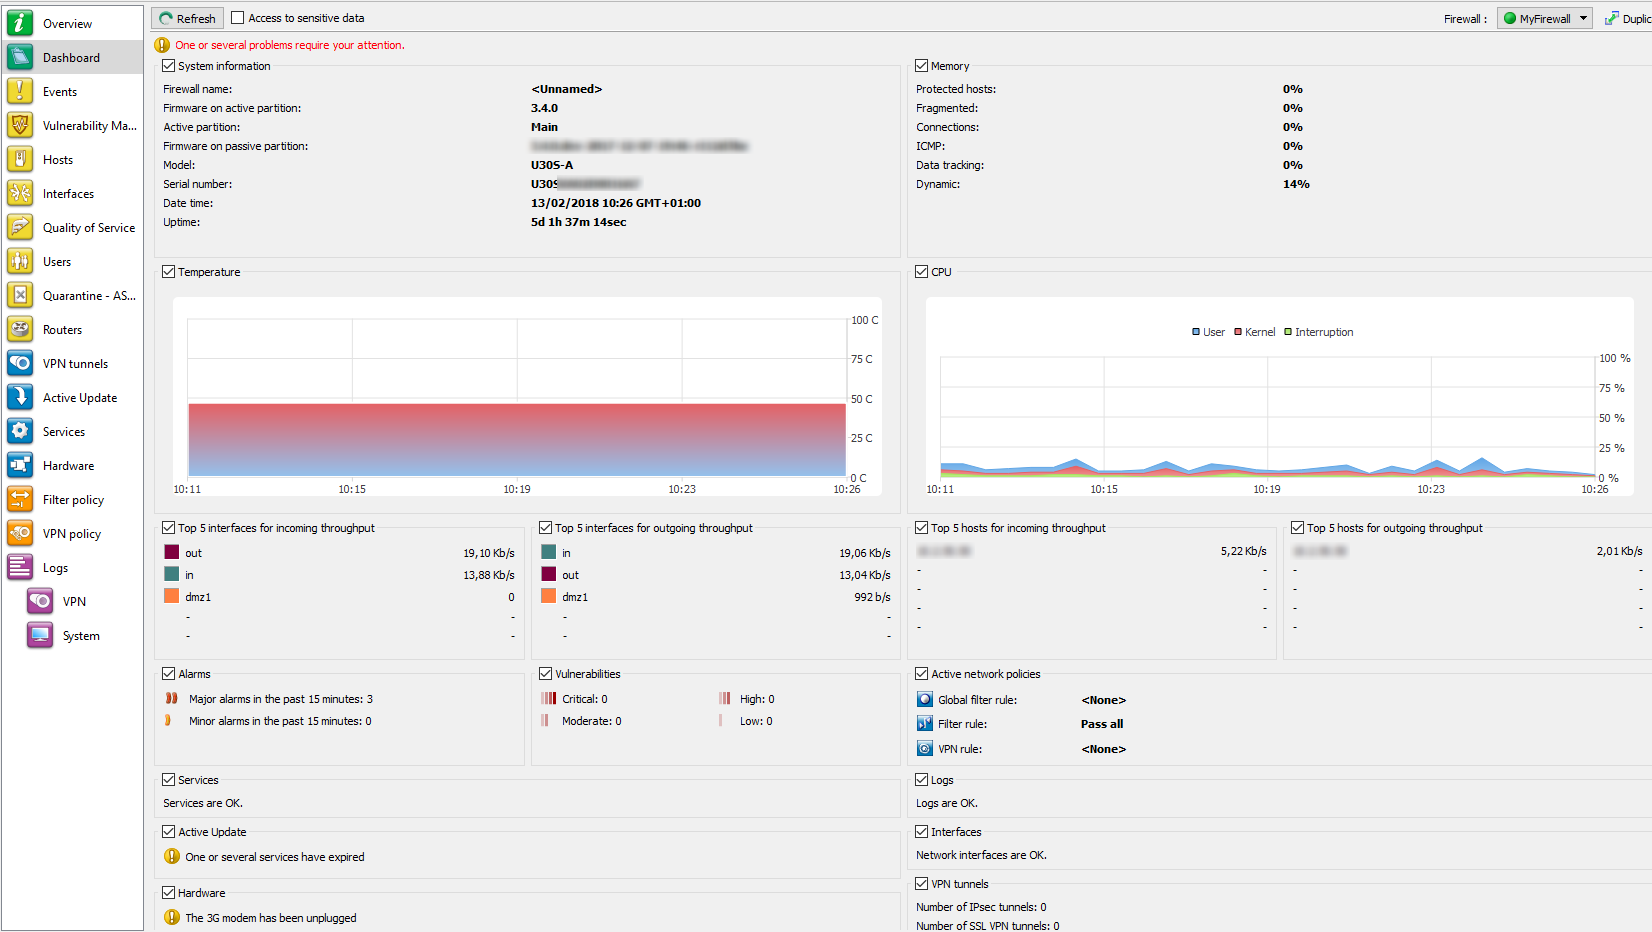
Figure 27: Dashboard
Selecting a product
When clicking in the Dashboard menu, a product selection window may appear if the Stormshield Network Real-Time Monitor is connected to several firewalls.
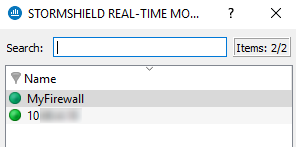
Figure 28: Selecting a firewall
 If the list of firewalls is long, look for the desired firewall using the Search field.
 Select the firewall.
 Click on OK. The Dashboard of the desired firewall will appear.
System information
|
Firewall name |
Name given to the product when it was registered in the address book. |
|
Firmware on active partition |
Version of the active partition’s firmware. |
|
Active Partition |
Partition on which the firewall was booted. |
|
Firmware on passive partition |
Version of the passive partition’s firmware. |
|
Model |
Firewall’s model number. |
|
Serial number |
Firewall’s serial number. |
|
Date-time |
Current date and time. |
|
Uptime |
Amount of time that the firewall has been running since the last startup. |
Memory
This refers to the use (in percentage) of memory reserved for storing information (buffer). The buffer is linked to the stateful module and corresponds to the context being saved.
|
Protected host |
Protected host stack |
|
Fragmented |
Fragmented packets |
|
Connections |
All TCP/IP connections. |
|
ICMP |
ICMP requests (ping, trace route, etc.). |
|
Data tracking |
Memory used for monitoring connections. |
|
Dynamic |
Percentage of ASQ memory being used. |
Buffer sizes vary according to product type and product version.
Cleaning algorithms optimize the operation of “Hosts”, “Fragmented”, “ICMP” and “Connections” buffers. Entries in the “Fragmented” and “ICMP” buffers are initialized at fixed intervals (each entry has a limited lifetime: TTL).
This illustrates part of the firewall’s activity. A high percentage may mean the firewall is overloaded or that an attack has been launched.
CPU
DEFINITION
Better known as a “processor”, this is the internal firewall resource that performs the necessary calculations.
|
User: |
CPU time allocated to the management of user processes. |
|
Kernel: |
CPU time that the kernel consumes |
|
Interruption: |
CPU time allocated for interruptions. |
Temperature
This graph displays the temperature of the appliance in degrees Celsius (°C). This information is not available on virtual machines. For multi-core processors, the value displayed is the average of all the CPUs.
Hardware
DEFINITION OF “HIGH AVAILABILITY”
A specific architecture in which a backup firewall takes over when the “main” firewall breaks down while in use. This switch takes place seamlessly.
If high availability has been activated, an additional section will provide you with the information regarding high availability (status of firewalls, licenses, synchronization).
Click on the descriptive phrase in the “Hardware” zone in order to display the Hardware menu and to obtain information on high availability and the status of the firewall’s components (S.M.A.R.T. peripherals, RAID volumes where possible, disks and power supply units).
If the backup firewall is not available, information on the active firewall can be viewed.
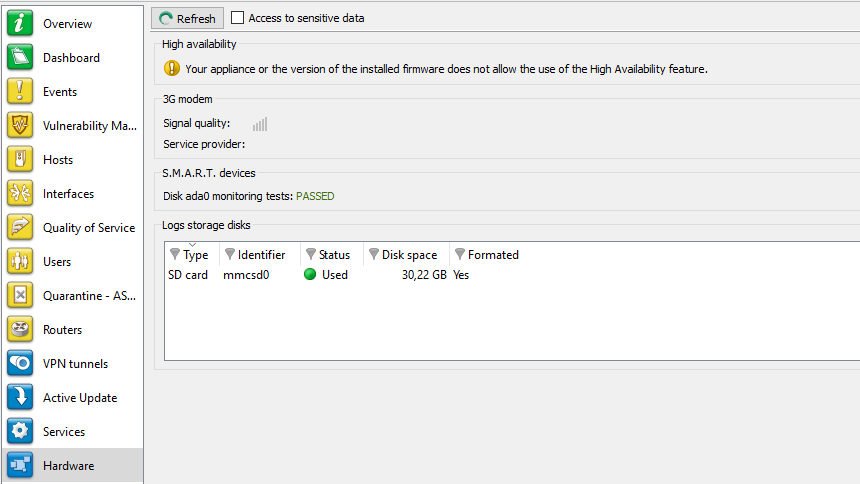
Figure 29: Hardware
Active network policies
This view indicates whether slots are active. If so, the name of the activated rule is indicated. The rules mentioned here are:
|
Global filter rules |
Name of the activated global filter policy. |
|
Filter rule |
Name of the activated filter policy. |
|
VPN rule |
Name of the activated VPN rule. |
|
Translation rule |
Name of the activated translation policy. |
|
URL filter rule |
Name of the activated URL filter rule. |
REMARK
<None> means that no policy has been activated for the rule that contains this indication.
Alarms
This view indicates the number of major and minor alarms during the past 15 minutes that the product has been connected. The maximum value indicated is 100 even if the number of alarms exceeds this value.
To view the alarms, click on either link of your choice – the Events menu will appear and will set out the list of alarms according to the selected criticality.
Vulnerabilities
This view indicates the number of vulnerabilities for a specific level. The 4 levels of vulnerability are: Critical, High, Moderate and Low.
To view a list of vulnerabilities, click on one of the levels, and the menu Vulnerability management will appear (Cf. section Vulnerability Manager).
VPN tunnels
This view indicates the number of configured VPN tunnels. To view a list of configured VPN tunnels, click on the link – the VPN Tunnels menu will appear.
Active Update
This view indicates the status of updates that have been performed (success or failure) as well as the last time the “Active Update” module had been launched (date and time). To view a list of updates and their status, click on the link – the Active Update menu will appear.
Logs
This window indicates whether there are problems with the logs. To view a graph that represents the current size of the log file in real time (Alarms, Authentication, Connections, Filters, Monitor, Plugins, POP3, Vulnerability Manager, Administration, SMTP, System, IPSec VPN, Web, SSL VPN) in relation to the space allocated to each log type on the firewall, click on the link. The Logs menu will appear.
Services
This zone indicates whether there are problems with the services. To view a list of services and their status (Enabled/Disabled), click on the link – the Services menu will appear.
Cache proxy
These 3 pie charts represent the use of the HTTP cache when it has been enabled in the filter rules:
- The first graph compares the number of cached requests and the number of requests that were not saved in memory.
- The second graph compares the amount of cached data and the amount of data not saved in memory.
- The third graph represents the distribution of cached data on the hard disk, data cached in RAM and data not saved in memory.
Interfaces
This zone indicates whether there are problems with the interfaces. To view information on bandwidth, connections and throughput, click on the link. The Interfaces menu will appear.
Top 5 interfaces for incoming throughput
This zone displays the list of the 5 interfaces that have registered the most incoming throughput. Click on any one of the interfaces to display the Throughput tab graph in the Interfaces menu.
Top 5 interfaces for outgoing throughput
This zone displays the list of the 5 interfaces that have registered the most outgoing throughput. Click on any one of the interfaces to display the Throughput tab graph in the Interfaces menu.
Top 5 hosts for incoming throughput
This zone displays the list of the 5 hosts that have registered the most incoming throughput. Click on any one of the interfaces to display the Throughput tab graph in the Interfaces menu.
Top 5 hosts for outgoing throughput
This zone displays the list of the 5 hosts that have registered the most outgoing throughput. Click on any one of the interfaces to display the Throughput tab graph in the Interfaces menu.
Stormshield Management Center
When the firewall is managed from Stormshield Management Center, this view will show several indicators relating to the connection to the SMC server and the version of the configuration currently deployed on the appliance:
|
Status of the connection |
Indicates whether the connection between the firewall and the Synapse server has been established (Connected / Disconnected). |
|
IP address |
IP address of the Synapse server |
|
Logged on/ Logged off since |
Specifies the time/date from which the firewall has been logged on to or logged off from the Synapse server. |
|
Deployment version |
Indicates the number of the last configuration deployment carried out by the Synapse server on the firewall. |
|
Last configuration update |
Indicates the last date on which the configuration was sent by the Synapse server to the firewall. |