Monitoring the status of communications between TS Agents and the SNS firewall
Various events can be viewed in the firewall's web administration interface, to monitor the status of communications between TS Agents and the SNS firewall.
From the Dashboard module
TS Agents' statuses can be viewed in the Monitoring tab > Dashboard module > Services widget:
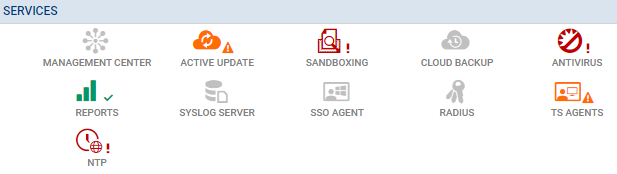
Depending on the status of TS Agents, the colors and symbols of the icons change:
- Gray icon without a symbol: all TS Agents configured on the firewall are inactive.
- Green icon and
 symbol: communication with all configured active TS Agents is optimal.
 - Orange icon and
 symbol: communication with at least one of the configured active TS Agents has encountered an issue. Scrolling over the icon will show a tooltip that explains the reason for this status.
 - Red icon and
 symbol: communication with all TS Agents has been disconnected. Scrolling over the icon will show a tooltip that explains the reason for this status.
Double-clicking on the TS Agents icon will redirect you to the TS Agents widget in the System monitoring module.
From the System monitoring module
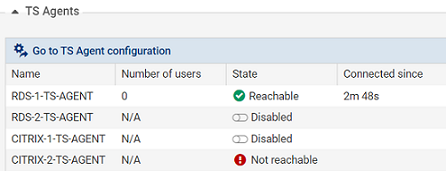
Details on the status of each TS Agent can also be viewed via the Monitoring tab > System monitoring module > TS Agents widget.
This grid presents the following information for each TS Agent configured on the firewall. including agents that have not been enabled:
- The name of the TS Agent,
- The number of users connected via this TS Agent,
- The status of the TS Agent (Reachable, Unreachable or Disabled),
- Time lapsed since the connection between the firewall and the TS Agent.
From the Logs - Audit logs module
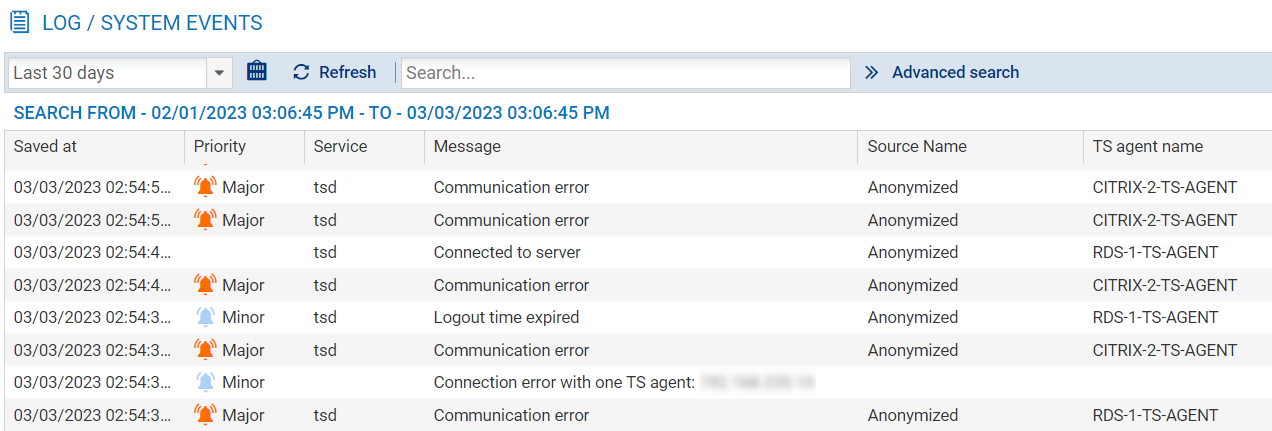
System events
Look up events regarding communication between the firewall (TSD service) and TS Agents in Monitoring > Audit logs > System events:
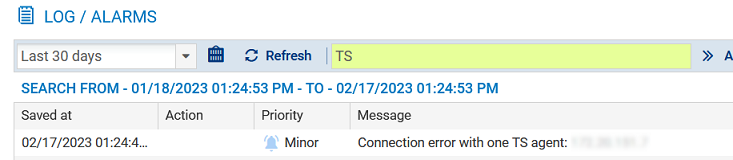
Alarms
Look up alarms regarding communication between the firewall and TS Agents in Monitoring > Audit logs > Alarms: