Monitoring SD-WAN links from the firewall’s administration interface
The monitoring module makes it possible to show the status of SD-WAN gateways as well as the values of the metrics relating to SLA thresholds.
Overview: dashboard of health indicators
The SD-WAN dashboard, available in the Monitoring tab > Dashboard module > Health indicators section, offers a quick view of the status of all SD-WAN objects:
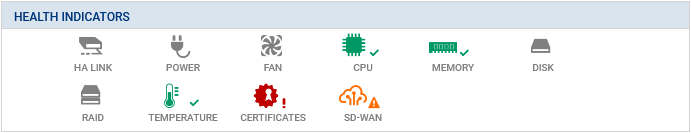
The color of the SD-WAN icon varies according to the status of the routers and gateways used in the firewall configuration:
- Green: all router gateways are functional and meet the defined SD-WAN SLA criteria,
- Orange: a router has a degraded status as one of its gateways has a degraded status, or cannot be reached,
- Rouge: a router cannot be reached as all its gateways are unreachable.
Clicking on this icon will take you directly back to Monitoring > SD-WAN.
Detailed view: the SD-WAN monitoring module
The SD-WAN module, which can be accessed from Monitoring > Monitoring, shows details of routers and gateways used in the firewall's routing settings (default route, static routes and policy-based routing).
Real time tab
The Real time tab shows information about the status of monitored routers and gateways, as well as the SD-WAN SLA values of these gateways.
The values may be as follows:
| Type | Status | SLA status |
| Gateway |
|
|
| Router |
|
|
Example of a router with load balancing
For more details on the values that the various indicators may show, refer to the module on SD-WAN monitoring in the Stormshield SNS v4 user guide.
In this example, both gateways have been enabled.
Load balancing values between both gateways are shown: they depend on the weight assigned to each gateway. When all gateways have a weight of 1, this means that each of them have been assigned 100% load balancing:
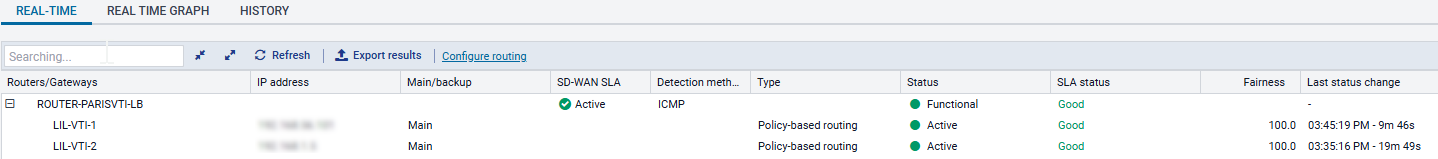
By scrolling over the SLA status of a gateway, the last measured indicator value will be shown:

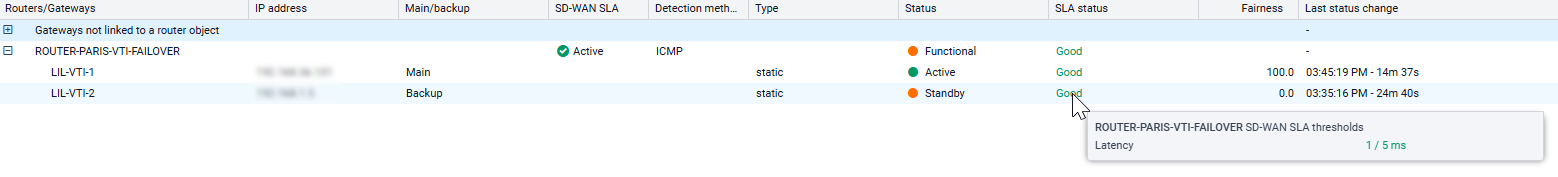
Example of a router with failover
One gateway is active, while the other is on standby.
Load balancing between both gateways is indicated: the active gateway indicates 100%, while the standby gateway is at 0%.

By scrolling over the SLA status of a gateway, the last measured indicator value will be shown:
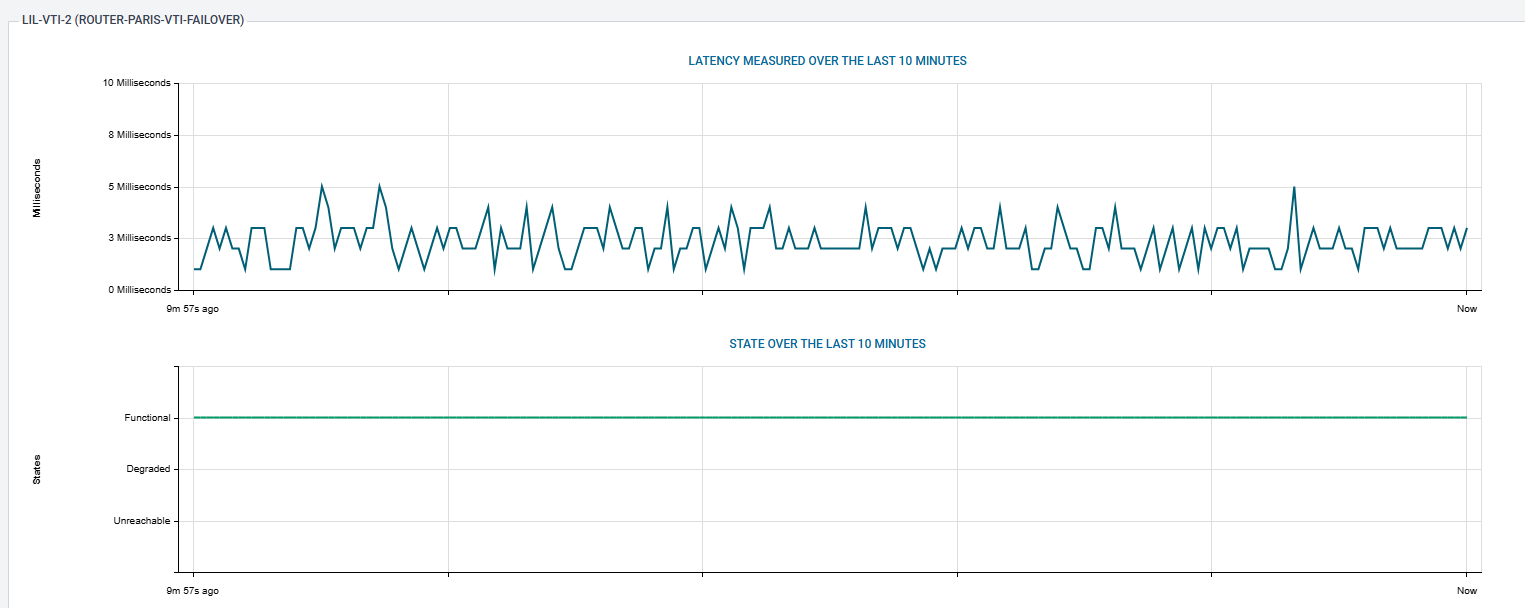
Real time chart tab
In this tab, a router gateway can be selected to display curves that show changes to the following SLA indicators over the past 10 minutes:
- Latency,
- Percentage of time spent in the various possible statuses (functional, degraded and unreachable).
Example:
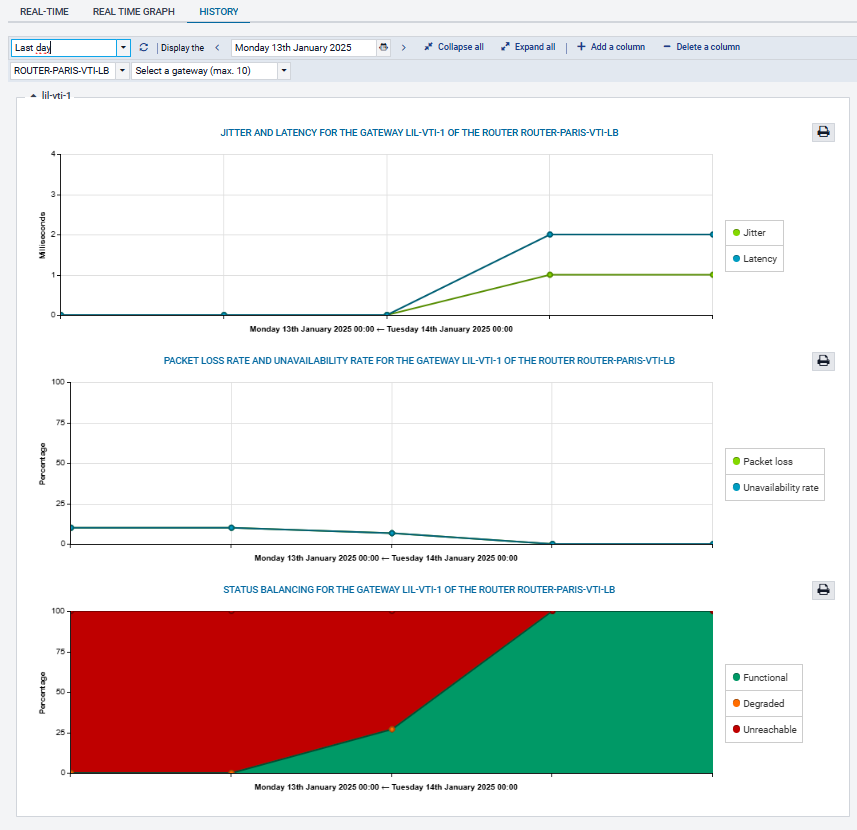
History tab
In this tab, up to five router gateways can be selected to display curves that show changes to the various SLA indicators over the selected period:
- Jitter and latency,
- Packet loss rate and unavailability rate,
- Percentage of time spent in the various possible statuses (functional, degraded and unreachable).
Example: