Monitoring QoS
The web administration interface allows the user to view in graphs the amount of bandwidth used by queues defined on your SNS firewall.
Configuring monitoring
Go to Configuration > Notifications > Monitoring configuration, QoS configuration tab.
- Click on Add.
- Select the queue that you wish to monitor.
- Repeat steps 1 and 2 for all queues that you want to monitor.
- Click on Apply.
Viewing graphs of bandwidth used by QoS queues
Go to Monitoring > Monitoring > QoS.
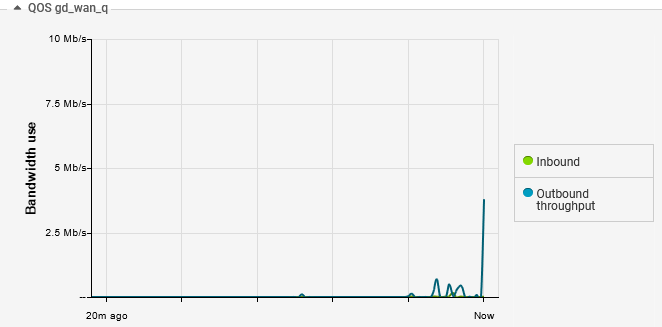
Real time tab
The Real time tab displays a graph showing bandwidth use for each monitored QoS queue. These graphs are refreshed in real time:
History tab
The History tab displays an aggregate of bandwidth usage data and packet processing data for each monitored QoS queue:

The toolbar can be used to select the period represented:
- Last hour,
- A particular day,
- Last 7 days,
- Last 30 days.