Reading logs
Logs can be read in the web administration interface or directly in files stored on the hard disk or SD card. If logs are sent to a Syslog server or through an IPFix collector, they can also be read in these programs.
In a high availability (HA) cluster, logs are not replicated on all nodes. The active firewall writes logs to its hard disk. If the firewall becomes the passive firewall, the other active firewall will continue writing logs. As a result, neither firewall in the cluster contains all logs, and the web administration interface displays only logs found on the firewall to which it is connected. To read logs more easily in a HA setup, send them to a Syslog server.
In line with the General Data Protection Regulation (GDPR), access to firewall logs is restricted by default for all administrators. The admin super administrator can easily access full logs but other administrators must request a temporary access code. Every time a request is submitted for full access to logs, a log will be generated. For further information, refer to the Technical note Complying with privacy regulations.
- In the upper part of the web administration interface, click on the Monitoring tab.
- In the menu on the left, select Logs-Audit logs.
- To display all logs, click on All logs. Otherwise, select the desired view.
Logs are displayed in chronological order, the first being the most recent. Only logs from the last hour are displayed by default, but the time range can be changed by clicking on the drop-down list. - Click on Actions > Expand all elements if you wish to display all available columns.
- To filter logs, enter text in the Search field or click on Advanced search, then Add a criterion to combine various search criteria.
For further information on searches and displaying logs, refer to Views and Interactions in the User guide.
- Log in to the firewall in SSH to read logs stored in the /log folder. These logs consist of the following files:
| l_alarm | Events relating to intrusion prevention functions (IPS) and those logged with a minor or major alarm level in the filter policy. |
| l_auth | Events relating to user authentication on the firewall |
| l_connection | Events relating to TCP/UDP connections allowed to and from the firewall, which have not been analyzed by an application plugin. The log is written when the connection ends. |
| l_count | Statistics regarding the number of times a rule has been executed. Such logs are not generated by default. For further information, see Adding logs to filter rules. |
| l_date | Events relating to time changes on the firewall. |
| l_dmrouting | Events related to the dynamic multicast routing service: traffic, receiver subscription/unsubscription ... |
| l_filter | Events relating to filter and/or NAT rules. Such logs are not generated by default. For further information, see Adding logs to filter rules. |
| l_filterstat | Statistics regarding the use of the firewall and its resources. |
| l_ftp | Events relating to connections going through the FTP proxy. |
| l_monitor | Statistics to compile performance graphs and security reports (web administration interface). |
| l_plugin | Events relating to processes carried out by application plugins (FTP, SIP, etc.). |
| l_pop3 | Events relating to connections going through the POP3 proxy. |
| l_pvm | Events relating to the option Stormshield Network Vulnerability Manager. |
| l_routing | Routing service events: changes to dynamic routes, adjacency states, etc. |
| l_sandboxing | Events relating to file sandboxing if the subscription for this option has been activated. |
| l_server | Events relating to the administration of the firewall |
| l_smtp | Events relating to connections going through the SMTP proxy. |
| l_ssl | Events relating to connections going through the SSL proxy. |
| l_system | Events directly relating to the system (shutdown/reboot of the firewall, system error, service operation, etc). |
| l_vpn | Events relating to the IPSec VPN tunnel negotiation phase. |
| l_web | Events relating to connections going through the HTTP proxy. |
| l_xvpn | Events relating to the setup of an SSL VPN tunnel (tunnel or portal mode). |
| l_routerstat | Statistics relating to router objects (SD-WAN). |
For more information on the various fields in these files, refer to the technical note Understanding audit logs.
As soon as a log file exceeds 20 MB, it will be closed to make way for another. The closed file can be found in the /log file under a new name. The number of log files that are retained for each log category depends on the amount of disk space assigned to the log category in question (Configuration > Notifications > Logs - Syslog - IPFIX > Local storage tab).
EXAMPLE
If 3.2 GB of storage space has been allocated to the IPsec VPN log category, 160 IPsec log files can be retained (20 MB * 160 = 3.2 GB).
Archive names
Closed log files are named according to the following structure:
- Type of log file (e.g.: l_filter, l_alarm, etc.),
- An 8-digit index number (starts from 0),
- Creation date: GMT date of the first log contained in the file,
- Closing date: GMT date of the last log contained in the file,
- The number of logs stored in the file.
Example:
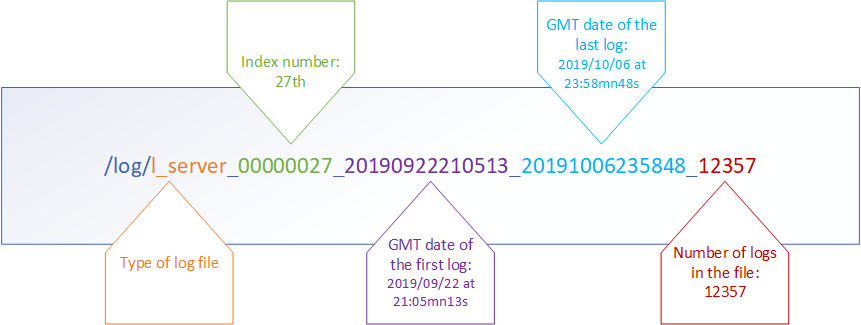
File indexation (managed incrementally and starting from 0) makes it possible to not have to rely only on creation or closing dates, as these dates may be distorted when the time is changed on the firewall.
Managing log storage
By default, when the storage space reserved for a log type reaches full capacity, the oldest archive file will be erased to free up space.
Two other courses of action are available, and can be enabled for each type of log file using CLI/serverd CONFIG LOG commands:
- Logs stop being generated once the dedicated space reaches full capacity,
- The firewall shuts down once the dedicated space reaches full capacity.
For more information on the syntax of these commands, refer to the CLI SERVERD Commands Reference Guide.