Monitoring the activity of SES Evolution backoffice components
The activity of backoffice components installed by SES Evolution generates logs the can be looked up in the administration console.
The System logs - Show privilege is required to read and filter logs.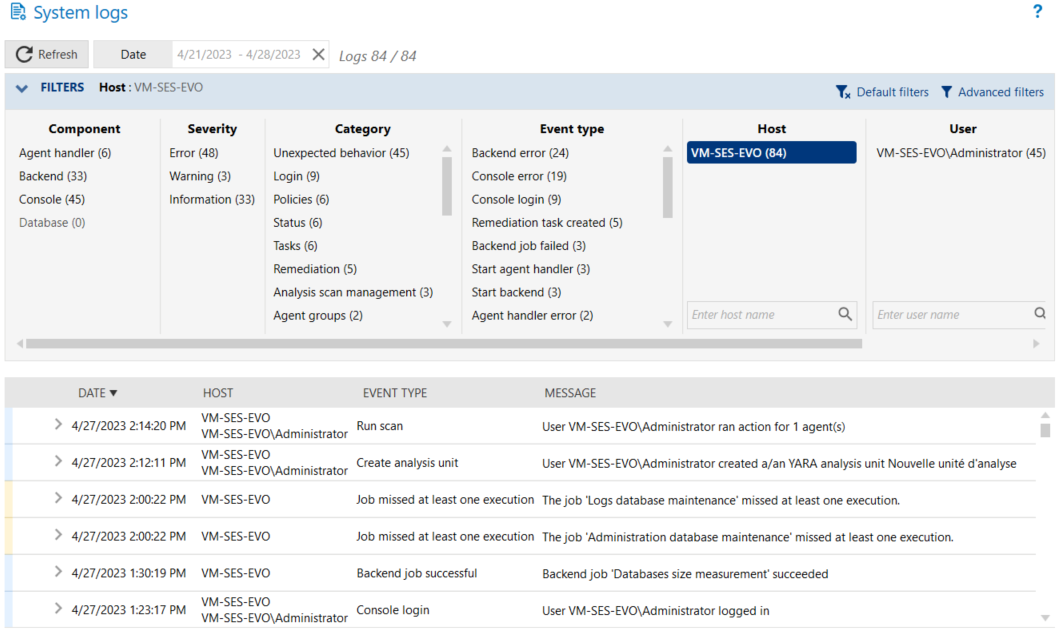
To read system logs:
- Select the Backoffice > System logs menu.
Logs from all components appear according to the active filters applied. The first time the log panel is opened, the logs displayed will be all the logs that were generated over the past 24 hours. - Click on the Date button to select the period that you want to view, and click on Apply. With the double arrow, select the period from a calendar. The cross to the right of the Date field resets the period to the last 24 hours.
The list of logs generated during the selected period appears. - In the Filters table, enable filters to customize your list of logs. Every column corresponds to a type of filter and contains several values. Click on these values to enable the corresponding filter.
You can look for hosts and users in the Machine and User columns by entering full or partial names in the search field.
You can go back to your initial filtering at any time, by clicking on Default filters: all logs will be displayed again.
The color on the left in a row of logs indicates its severity:- Blue: Information,
- Yellow: Notice,
- Orange: Error.
- Click on the small arrow to the left of the log to open it and display additional information:
- Details tab: Full description of the event that caused the generation of the log.
- Raw log tab: code of the log in JSON format.