Understanding the dashboard
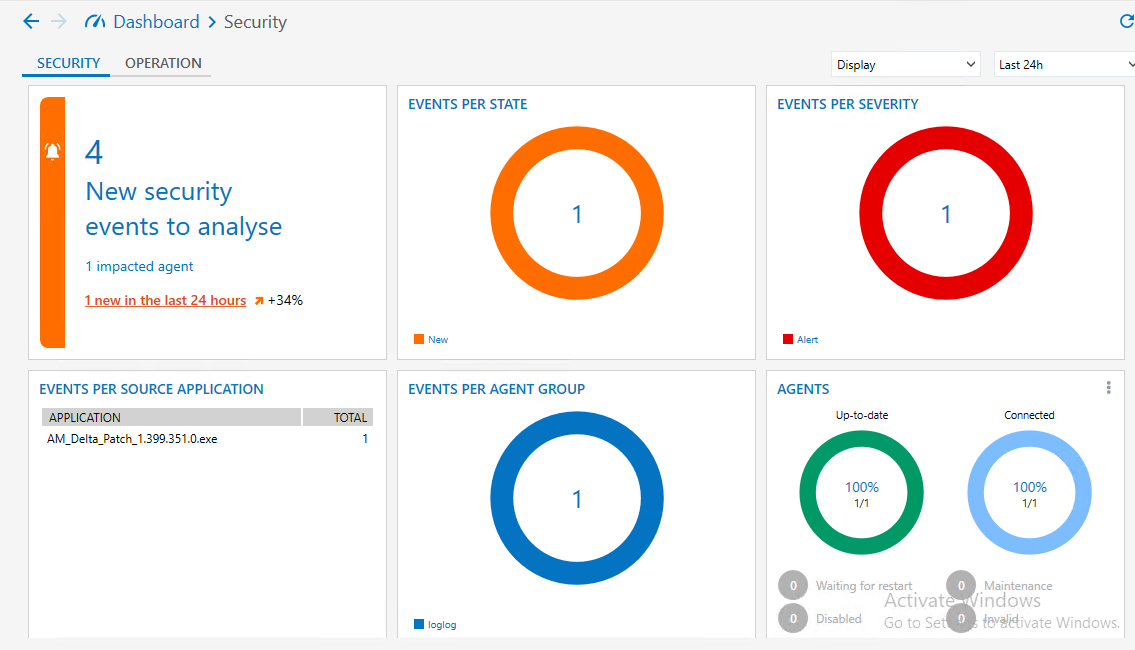
The SES Evolution dashboard provides an overview of the security status of your pool and how it is managed. You can identify the elements that cause issues at a glance, and access the various control or monitoring panels via shortcuts. The dashboard consists of several tiles.

The Attacks tile displays the number of attacks that your pool has detected and the number of agents affected. Statistics on attacks over the past 30 days are shown by default, but you can select a particular month from the drop-down list at the top on the right.
The following statistics are available:
- Processed and blocked: Number of incidents in which attacks were blocked and that are Fixed or Closed.
- Processed and not blocked: Number of incidents in which attacks were not blocked and that are Fixed or Closed.
- New and In progress: Number of New or Ongoing incidents.
False positive incidents are not listed in this tile. - Escalated agents: Number of agents on which incidents were generated.
For more information on the various attacks and statuses, see the section Managing logs.
Different colored bars indicate proportion within the total number of incidents.
If you have kept the past 30 days as the default period, an icon appears on the right of the colored bars, showing how the number of incidents has changed over the 30 days prior to the current period.

The Recent threats tile displays the number of threats that SES Evolution agents were exposed to, in the form of bar charts. Daily statistics on threats over the current week are shown by default, but you can select a particular period from the drop-down list at the top on the right.
The following statistics are available:
- Incidents: Total number of incidents.
- Processed: Number of Fixed, False positive or Closed incidents.
- Fixed or closed: Number of Fixed or Closed incidents.
- False positive: Number of False positive incidents.
- Open or ongoing: Number of New or Ongoing incidents.
For more information on the various statuses, see the section Managing logs.
Scroll over the bar charts to show the corresponding number of incidents.

The Agents tile shows the number of agents, their SES Evolution version and their status.
Status | Description |
Up-to-date | The software, policy and configuration version of the agent matches the version defined in its agent group. The agent may sometimes have a higher software version if it cannot revert to an older version and if the agent was forced to update. |
Connected | The agent connected back to its agent handler within the normal period defined in its group. |
Disabled | The agent was disabled by a challenge. |
Waiting for restart | The agent had to be restarted to complete an installation, an update or to apply changes. |
Maintenance | Maintenance mode is enabled on the agent. |
Invalid | The agent reported issues after an integrity check. |
The SES Evolution agent versions diagram shows how software versions are distributed in your pool. Scroll over the part of the circle corresponding to a version to show the number of agents concerned.
Click on to export the list of all agents in the pool, or a list of agents by status, in a .csv file.
The image above shows that the pool consists of 21 agents, 11 of which are in maintenance mode and only one is up to date. All of the agents are connected.
Click on Agents at the top left side of the tile to go to the general panel for agents. For more information, please refer to the section Viewing agents in the console.

The Licenses tile shows license information in a diagram.
The diagram will show the number of active agents and the proportion compared to the number of agents allowed in the license. An agent is considered active if it has connected to the agent handler within the past 10 days. The color of the diagram changes according to the proportion of licenses used.
Green | The number of active agents is below 90% of licenses’ full capacity. |
Orange | The number of active agents is between 90% and 110% of licenses’ full capacity. |
Red | The tolerated threshold of 110% has been exceeded. |
Gray | The license has expired. |
License information is refreshed every hour and every time you access the dashboard.
Click on Licenses at the top left side of the tile to go to the panel for licenses. For further information, refer to the section Managing SES Evolution licenses.

The System tile shows the statuses of various servers in different colors: backend server, databases and agent handlers. For more information, refer to the SES Evolution Installation Guide.
If an issue is detected on a server, SES Evolution will generate a system log, and the color of the server's icon changes.
Backends
The backend is the application server that centralizes all operations performed in the SES Evolution environment. The backend icon changes color according to the amount of resources consumed:
Green | All backends are running, |
Orange | The average RAM or CPU consumption of one or several backends exceeds 90% (moving average over one hour), or the disk space used exceeds 75%. |
Red | The status of one or several backends has not been updated for more than 5 minutes or the task of deleting logs was not successfully carried out, or the disk space used exceeds 85%. |
Click on to obtain more accurate information on each backend’s resource consumption and the date of its last connection. The result of the log deletion task is also shown. If the task failed, move your mouse over the red cross of the Task column to show the exact error message. For more information on this task, refer to the section Managing the size of the log database.
Databases
SES Evolution runs with several databases, including an administration database and one log database.
The color of database icons changes according to whether they can be reached, and the amount of disk space used:
Green | All databases can be reached and less than 70% of the disk space is used. |
Orange | Between 70% and 80% of the disk space is used. |
Red | One or several databases cannot be reached, or more than 80% of the disk space is used. |
Click on to see when each database last connected.
Agent handlers
The agent handler receives data and logs directly from agents, and updates the administration database via the backend. The color of the agent handler icon changes according to its resource consumption:
Green | All agent handlers are operational. |
Orange | The average RAM or CPU consumption of one or several agent handlers exceeds 90% (moving average over one hour), or the disk space used exceeds 75%. |
Red | The status of one or several agent handlers has not been updated for more than 5 minutes, or the disk space used exceeds 80%. |
Click on to obtain more accurate information on each agent handler’s resource consumption and the date of its last connection.