Monitoring database size
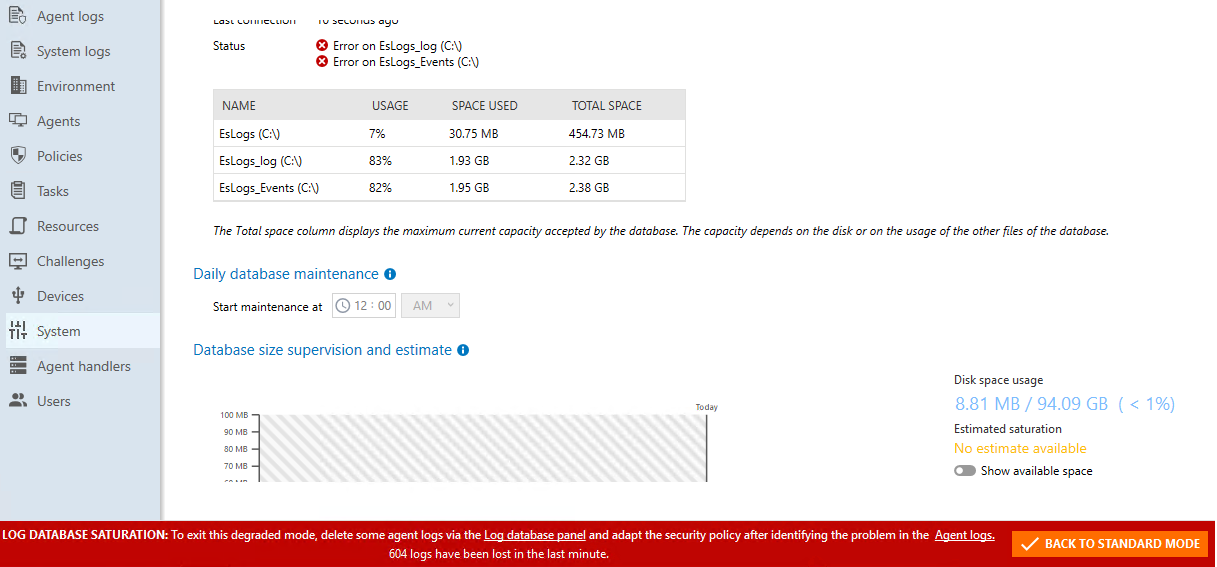
SES Evolution allows you to monitor the size of databases in several ways: through a chart, and through the automatic degraded mode for the log database.
-
Select the Backoffice > System menu and click on the desired database tab, Administration or Logs.
-
In the section Database size supervision and estimate, refer to the chart. It shows information on the occupation of the data over 9 months. For more information, see the section Understanding the database tracking graph.
-
A Warning log appears by default in the system logs three months prior to the database's estimated date of saturation, and an Error log appears a month before. Only in the log database, if the default values do not suit you, click on Edit in the upper banner and select the desired number of months by changing the following settings:
-
Generate a warning n months before estimated date of saturation
-
Generate an error n months before estimated date of saturation
A colored banner will also appear when the estimated date of saturation approaches: orange between one and three months from the date, or red from one month onwards.
-
-
Click on Save at the top right of the window to save changes.
Understanding the database tracking graph
The Database size supervision and estimate chart is divided into two parts:
-
The left side shows six months of database occupation history up to the current date. The database size is measured every day at 00:00 UTC. The points on the chart correspond to the measurement taken on the first day of every week.
-
The right side shows the projected increase in database occupation over three months from the current date. For greater reliability, it starts appearing only after the database has been used for 14 days.
The first orange dot indicates the date on which the database will be saturated in a pessimistic forecast model. The second orange dot represents the same date in an optimistic scenario.
-
Disk space usage: disk space used in relation to available space, and percentage of occupation.
-
Estimated saturation: period in which the database is estimated to reach saturation.
-
Show available space: makes it possible to show or hide available space on the chart and change the scale accordingly. Enable this option when the volume of the database becomes significant in relation to the available space.

To prevent the saturation of the log database when large quantities of logs are generated very quickly, a degraded mode is activated when the database reaches 81% of its maximum size. A red warning banner appears in the lower part of the administration console.
New agent and system logs sent to the Backoffice are no longer stored in the log database, but are permanently deleted.
However, if you have configured Syslog servers for agent managers, they will continue to receive agent logs.
To disable degraded mode and store logs again, reduce the log database volume until it is below the 81% threshold. To do so, follow the instructions below:
-
Analyze logs to understand the source of the logs,
-
Adjust your security policy to generate fewer logs, by reducing false positives, for example,
-
Once you have reduced the log volume, click on Back to standard mode in the red banner of the administration console.
The banner will disappear and logs will be stored in the log database again.