Analyzing contexts to understand attacks
- Choose the Environment > Agent Logs menu.
The full list of logs from all agents appears. - Click on the small arrow to the left of a context to open it. It is accompanied by the eye icon,
 or
or  . Even if grouped logs are shown, the context will contain only the log line with the highest severity. For further information on how to read logs, refer to the section Viewing and managing agent logs in the administration console.
NOTE:
You can also open external contexts exported earlier. Refer to Exporting contexts and viewing external contexts. - Click on the eye icon
 to the right of the context to display the detailed view of all the logs that make up the context. This view consists of several sections:
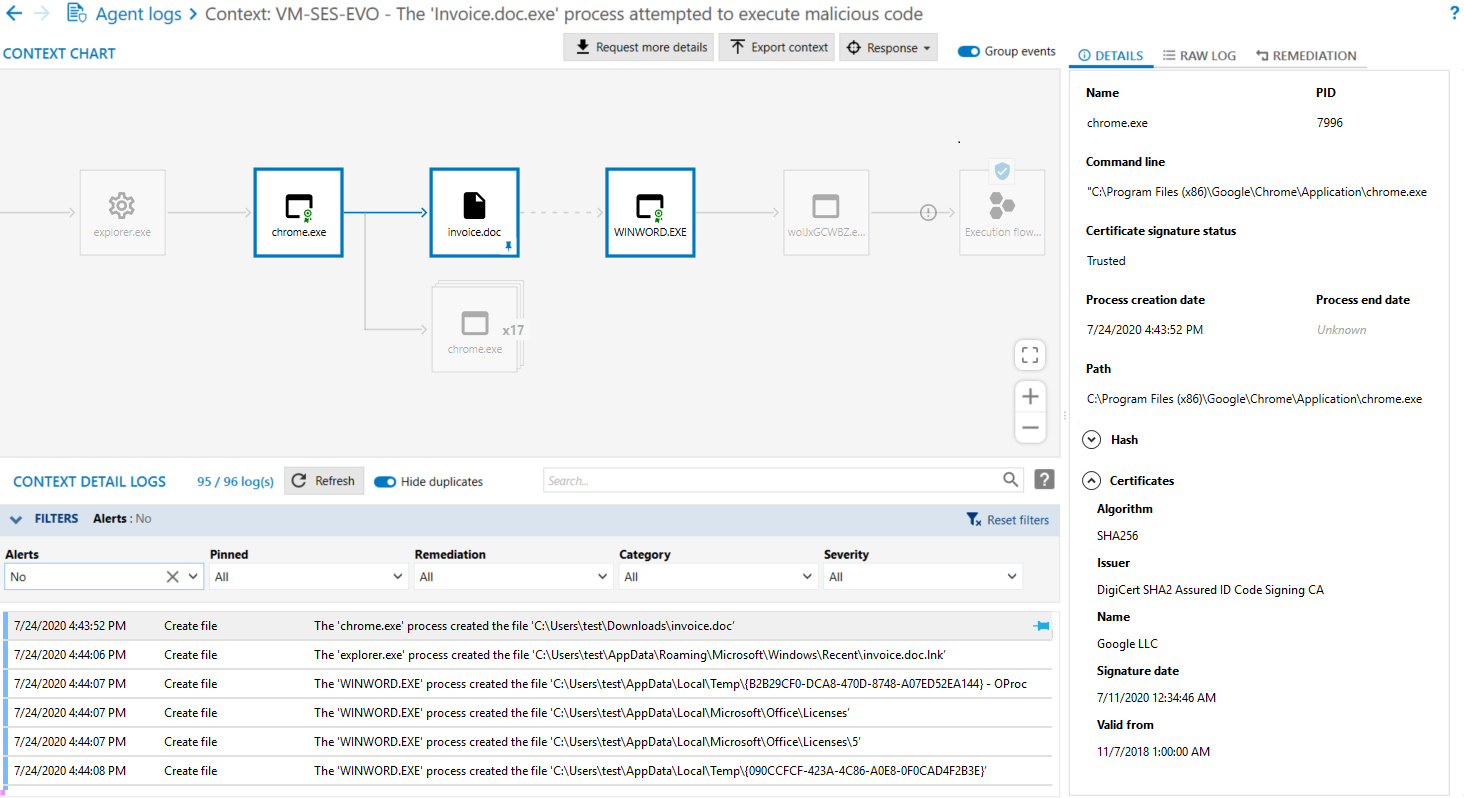
- Context chart: represents the attack launched on the agent in the form of a graph. It shows all the processes involved in the context and how processes are linked to one another.
- Context detail logs: lists all the logs of events surrounding the attack. A filter is enabled by default and only alerts are shown. Change the filters according to your preferences.
- Details or Raw logs view: additional information about the item selected in the graph. Raw logs are generated in JSON format.
- Remediation view: makes it possible to select and launch the desired remediation operations.
- When the view is opened, the context chart highlights with a small blue shield the item that was attacked. Click on the processes that come before it (i.e., parent processes) and read the related information in the right pane. The Hash is particularly useful in checking whether this process was already identified as malicious in the database of known malware.
A red struck-through seal on a process means that it was not signed by a digital signature certificate when it was compiled. - There is a red seal on its icon, meaning that the process is not signed,
- Its Name was randomly generated,
- It was executed by Winword, which does not usually execute such processes,
- Its Path C:\Users\abott\AppData\Local\Temp shows that it was run in a temporary folder.
- Depending on the agent group configuration, the context details may not appear automatically. If you need additional information, click on Request more details so that the agent will report all information to the agent handler. For further information on configuration, refer to the section Configuring context details generated by agents.
- To search for context logs, enter your character string in the Search field. The search syntax is as follows:
- If you have identified a log that may help you understand the attack, pin it to the chart by clicking on
 . This log will be added to the chart as a new event, and modifies the chart as a result.
To list only logs that match items in the chart, click on Pinned only. - To examine a specific part of the chart more closely, move your mouse and zoom using the buttons at the bottom right of the chart. You can also use the left button on the mouse together with the scroll wheel.
- Since identical processes are grouped by default, disable Group events at the top on the right to deploy items and analyze them individually.
- Once the scan is complete:
- In the Remediation tab at the top right side, create a remediation task by selecting the operations that you want to perform on the agents in question. Click on See remediation task to run the task. For more information, see the section Managing remediation tasks.
- Click on the back arrow at the top on the left to return to the standard log panel. All your changes will be saved and appear the next time you open the contexts view.
In our example, several indicators show that the first process is suspicious:
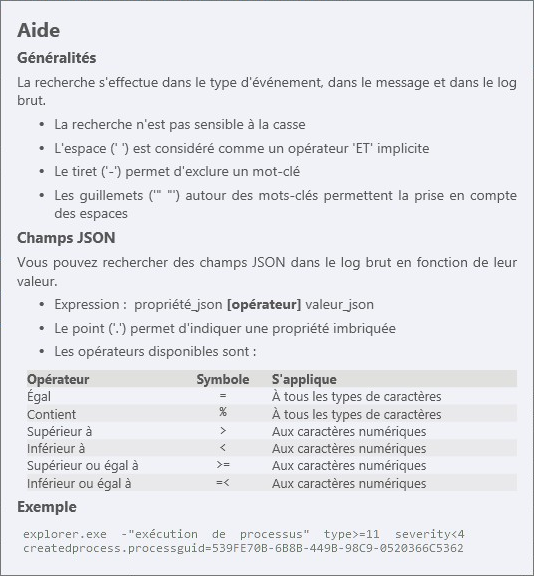
Searches will cover context detail logs.
Only logs that match the search will remain displayed in the list. Searches have no impact on the context chart.
EXAMPLE
In our example, the command line of the WINWORD.exe process indicates that a file invoice.doc was created. Searching for the string invoice.doc "file creation" will display all logs that include these terms and also reveal that chrome.exe created this file.
EXAMPLE
In our example, if you pin the log that mentions the creation of the invoice.doc file, you can understand how the attack was performed: the malware was launched on the workstation by an infected Word document (invoice.doc) that the user downloaded via Chrome and opened. It was a phishing attempt blocked by SES Evolution.